

Third Quarter 2026: Treading Water Through a Noisy Quarter
The third quarter offered yet another reminder that headlines and portfolio results don't always move together. Oil prices surged, the Federal Reserve raised rates for the first time in three years, and bond yields jumped sharply. Yet large U.S. stocks finished the quarter modestly higher, buoyed by strong corporate earnings. The net result, for the typical globally diversified portfolio, was something akin to treading water.
Below, we walk through what happened, what it means for your portfolio, and what we're focusing on in the months ahead.
Q3 By the Numbers
Returns were mixed across asset classes. Commodities and large U.S. stocks gained while bonds, real estate, and smaller companies (all more sensitive to interest rates) lost ground.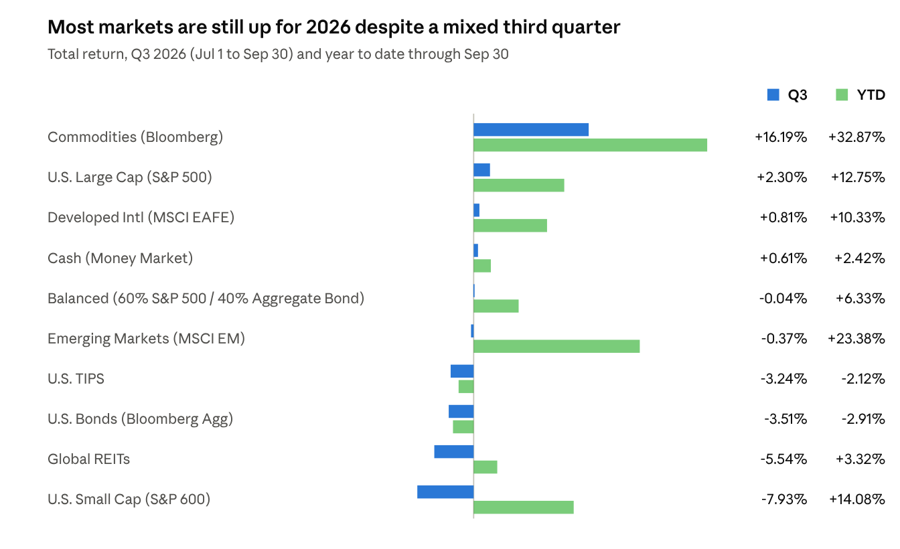
U.S. Large Cap stocks handily outperformed Small Caps, but the gains were deceptively narrow. Just four mega-cap technology companies (Apple, Meta, Nvidia, and Microsoft) accounted for more than 100% of the S&P 500's quarterly return (the other 496 companies detracted from performance, in aggregate, as the equal-weighted version of the index fell 1.9%). While the S&P 500 boasts a healthy year-to-date return of nearly 13%, fewer than half of the stocks in the index were trading above their trailing 200-day average price at quarter-end.
Corporate profits are the backbone of a strong U.S. stock market. S&P 500 earnings grew about 32% year over year in Q2, and 86% of companies beat estimates. Much of that growth is tied to the artificial intelligence buildout: the five largest cloud providers are on pace to spend nearly $700 billion on capital projects in 2026, up from under $100 billion in 2020.
Tax policy is adding a further lift. Last year's One Big Beautiful Bill Act (OBBBA) allows companies to deduct the full cost of new equipment for tax purposes right away rather than over several years. In the fiscal year just ended, Federal corporate income tax collections fell about 15%, to $381 billion, corporate tax receipts were 15% lower than in 2025 (and more than 25% lower than 2024) even as AI investment surged and corporate profits reached record highs. Lower taxes leave more residual profit for shareholders. The trade-off is a wider federal deficit, more government borrowing and, as discussed below, more upward pressure on interest rates.
Higher Oil Prices Keep Inflation Above Target
U.S. crude oil prices rose more than 30% in Q3 as tensions with Iran flared and attacks hit Saudi energy infrastructure near the Red Sea. Brent crude, the global benchmark, ended the quarter above $100 a barrel, roughly 40% higher than when the conflict began in late February. Retail diesel prices climbed about 37% during the quarter, to nearly $6.40 a gallon, heading into the fall harvest and holiday shopping season.
Households feel inflation most acutely at the pump. Regular gasoline averaged close to $4.50 a gallon in late September, near its spring peak and about 80 cents above where it stood at the same point in 2022.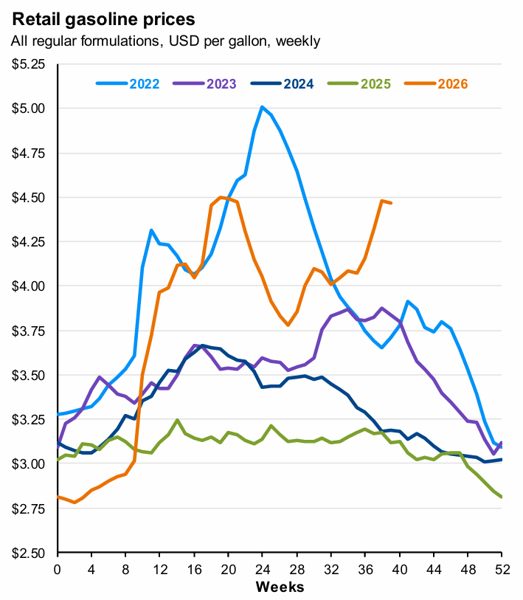
Source: J.P. Morgan Guide to the Markets, p. 29, as of Sept. 30, 2026. U.S. average price of regular gasoline by week of the year.
Energy costs are the main factor keeping inflation above target. Consumer prices (CPI) rose 3.7% through September, up from 3.4% in August and above economists' forecasts. Gasoline jumped 9.1% in September alone and accounted for more than half of the month's increase. More telling, core inflation, which leaves out food and energy, edged up to 2.6% from 2.4%, a sign that higher fuel and shipping costs are starting to show up in other prices, such as airfares. The Fed's preferred gauge (PCE) tells a similar story, with core inflation at 3.0% through August, well above the Fed's 2% target. The same pressure is showing up abroad: eurozone inflation jumped to 3.8% in September, and the European Central Bank and Bank of Japan both raised rates alongside the Fed.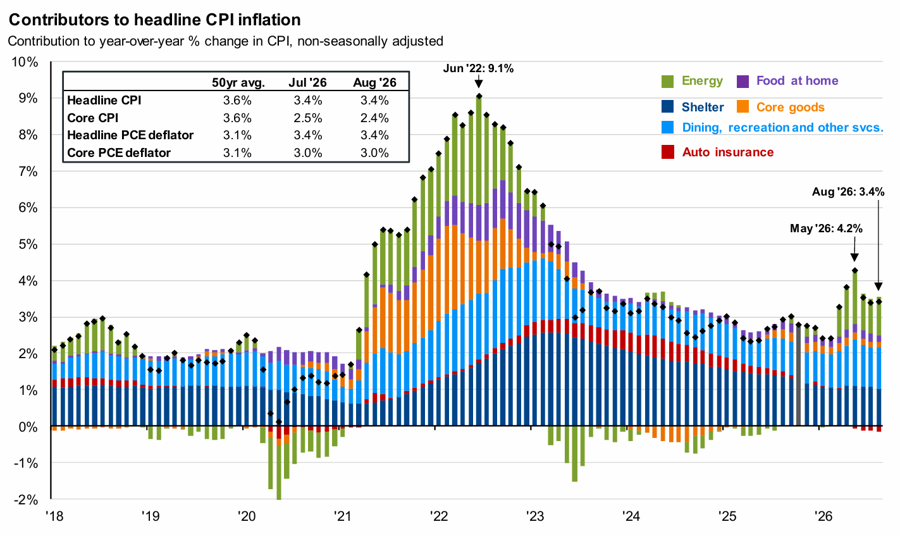
Source: J.P. Morgan Guide to the Markets, p. 20, data through August 2026. Each bar splits the year-over-year rise in consumer prices into its sources. Energy (green) drove this spring's jump and is doing so again, while shelter (dark blue), the biggest driver of the past few years, keeps shrinking.
The numbers offer some reassurance. Wage growth is not a major source of today's inflation, which makes a self-reinforcing cycle of rising pay and rising prices less likely. Most of the pressure is coming from energy and services, and energy-driven inflation can fade quickly if oil prices ease.
A Rough Quarter for Bonds — With a Silver Lining
Bonds had their worst quarter since 2022. The 10-year Treasury yield rose about 0.85 percentage points to roughly 5.3%, its highest level since 2002. Sticky inflation, high oil prices, heavy government borrowing and a wave of AI-related corporate debt issuance all pushed yields higher. In September, the Fed raised its target fed funds rate by 0.25% to 3.75%–4.00%, its first increase since July 2023.
How much a bond’s price fell depended mostly on its maturity. Long-term bonds are the most sensitive to rate changes, so they lost about 7.5%, while short-term bonds barely moved. Floating-rate loans, whose interest payments reset higher when rates rise, actually gained.
The silver lining is income. The broad U.S. bond market now yields about 5.6%, up from 4.3% at the start of the year. Historically, a bond portfolio's starting yield has been the best guide to what it earns over the next five years. This quarter's losses are, in effect, the price of locking in higher income going forward.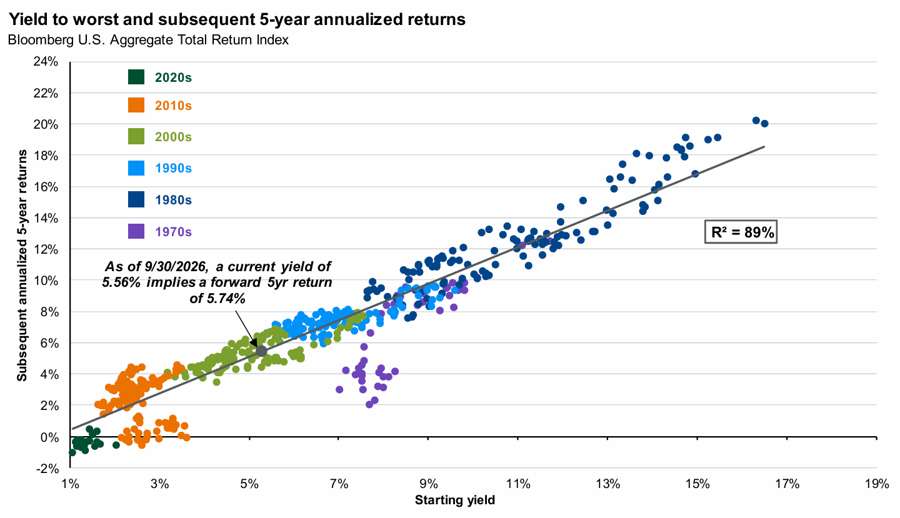
Source: J.P. Morgan Guide to the Markets, p. 41, as of Sept. 30, 2026. Each dot compares the bond market's yield at a point in time with its average annual return over the following five years. At today's yield of about 5.6%, that history points to roughly 5.7% a year.
A rough stretch can make it easy to forget why we own bonds. Over the last century, the broad bond market rose in 21 of the 25 years when stocks fell, often cushioning much of the loss. The rare exceptions, like 2022, came when surging inflation and rising rates hit stocks and bonds at the same time. With yields now at a higher starting point, bonds have more room to rally if the economy slows and rates fall, which is exactly when stocks tend to struggle.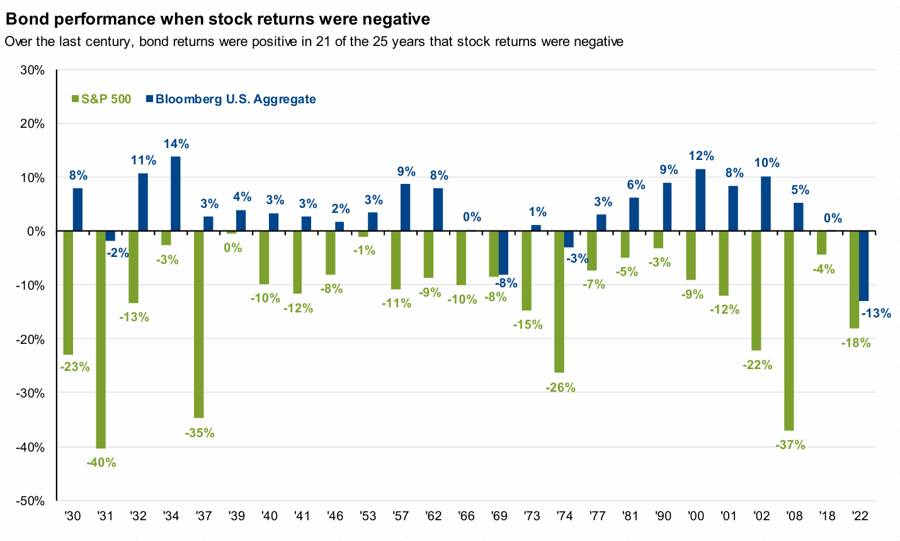
Source: J.P. Morgan Guide to the Markets, p. 40, as of Sept. 30, 2026. Calendar-year returns of the S&P 500 and the Bloomberg U.S. Aggregate bond index in each year since 1930 that stocks declined.
Municipal bonds had a tougher quarter than most of the bond market, falling about 6.3%, and September was their worst month since 2008. The upside, again, is a much higher yield. The broad municipal bond market now yields about 4.8% free of federal income tax. For an investor in the top federal bracket, that is equivalent to about 8.1% from a taxable bond (assuming the 37% federal rate plus the 3.8% net investment income tax).
Even better, those higher yields come with a much-improved credit profile for municipal issuers. State and local governments owe about 10% of GDP in total, a share that has drifted lower over the past decade, while federal debt has climbed to nearly 100%. States have also built up large rainy-day funds: the median state now holds roughly 14% of a year's spending in reserve, near a record and about three times what it held before the 2008 financial crisis. For clients in high tax brackets with taxable accounts, municipal bonds are an attractive place to add income today.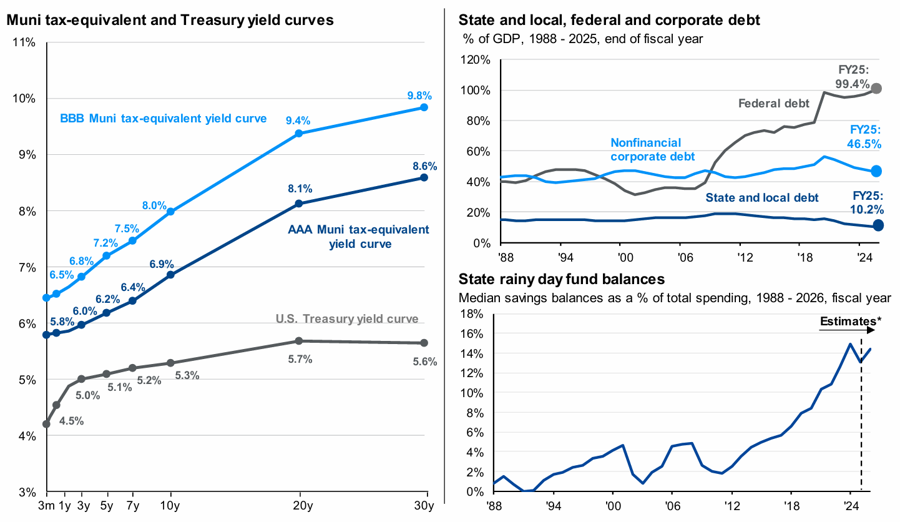
Source: J.P. Morgan Guide to the Markets, p. 38, as of Sept. 30, 2026. Left: muni yields restated as the taxable yield a top-bracket federal taxpayer would need (40.8% rate, before any state tax), compared with Treasuries. Top right: debt as a share of GDP. Bottom right: median state rainy-day fund balance as a share of annual spending.
Real Yields: A Rare Chance to Lock in Inflation-Protected Income
A bond's "real" yield is what it pays above inflation. The purest measure is the yield to maturity on Treasury Inflation-Protected Securities (TIPS), which rose from about 1.7% at the start of the year to about 2.8% by September 30, roughly matching the rise in the 10-year Treasury yield. In other words, investors are demanding more from bonds mainly because the economy is strong and the government and corporations are borrowing heavily, not because they expect inflation to spiral. In September, the Treasury sold new 10-year TIPS at a real yield of about 2.65%, the highest at a 10-year TIPS auction since October 2008.
It helps to think of an interest rate as the price of money. Like any price, it is set by supply and demand: how much savers are willing to lend, and how much borrowers want to borrow. After the 2008 financial crisis, aggressive monetary policy meant that the world had more savings than good uses for them, so borrowing was cheap and inflation-adjusted yields occasionally dipped below zero. Today the picture has flipped. Washington is running deficits of roughly 6% of GDP, and the five largest cloud providers alone are on pace to spend nearly $700 billion on new projects this year. Governments and companies are competing for the same pool of savings. This competition, more than fear of inflation, explains much of the rise in yields, since long-term inflation expectations have stayed fairly steady.
The chart below demonstrates the anomaly in real yields. For most of the 13 years after the financial crisis, a 10-year TIPS paid less than 1% above inflation, and in two stretches (2012–13 and 2020–22) its real yield was below zero, meaning investors effectively paid for inflation protection. Today's real yield of nearly 3% is the highest since 2008 and above where it sat in the years before the crisis.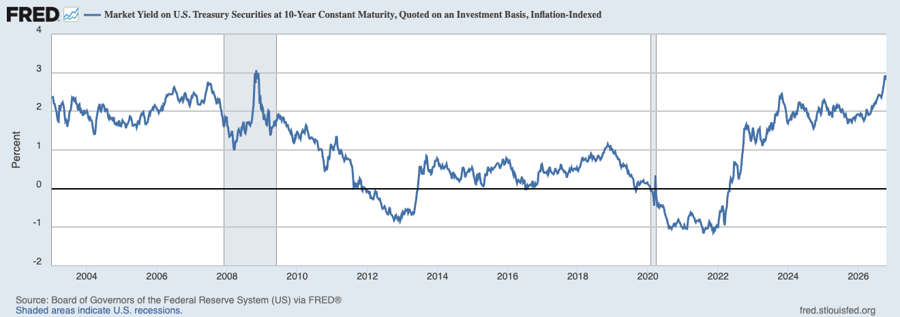
Source: Board of Governors of the Federal Reserve System, via FRED (Federal Reserve Bank of St. Louis), weekly data through October 2026. The line is the yield on a 10-year TIPS, which is what it pays above inflation. Shaded areas mark recessions; the brief spike in late 2008 reflected crisis-era selling rather than a lasting level.
TIPS are U.S. Treasury bonds whose principal rises with the Consumer Price Index, so they pay their real yield plus whatever inflation turns out to be. That makes the comparison with a regular Treasury simple: TIPS come out ahead if inflation averages more than the gap between the two yields, about 2.5% a year today. Inflation ran 3.7% over the year through September.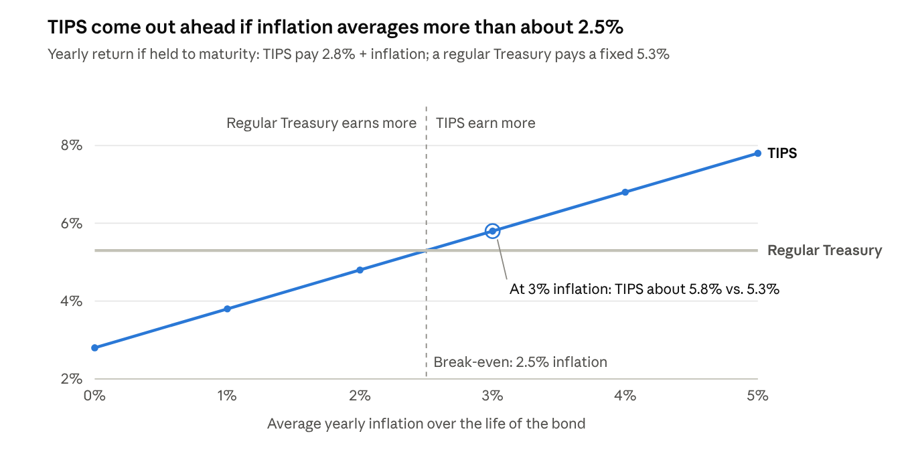
Illustrative, using rounded Sept 30, 2026 yields from J.P. Morgan Guide to the Markets, p. 34 (TIPS real yield 2.82%, 10-year Treasury 5.29%). Assumes bonds are held to maturity; before taxes and fees.
Rising real yields did cost TIPS holders in the short run. TIPS fell 3.24% in Q3, close to the broad bond market's 3.51% decline. As with other bonds, that price drop created today's buying opportunity.
For some clients, when suitable, we modestly increased intermediate-term TIPS relative to short-term TIPS. Short-term TIPS mature within a few years, and that money then must be reinvested at whatever real yields are available at the time, which could be lower. Intermediate-term TIPS let us lock in today's historically attractive real yield for longer while keeping the inflation protection. The trade-off is that longer bonds move more in price when rates change, so we kept the shift modest and made it only where it fits a client's time horizon and goals.
Looking Ahead to Q4: Year-End Tax Planning
The last few months of the year are critical for tax planning, because most strategies must be completed by December 31 to count for 2026. Information is key: the more we know about your income, deductions, and plans for the year, the more we can help. Newer planning software now lets us project your 2026 tax picture before you act, so we can show you the tax impact of a decision, or compare a few scenarios side by side, rather than guess. A few examples of where this can add value:
- Required minimum distributions (RMDs). If you are 73 or older, your RMD must be taken by year-end. If you are charitably inclined and 70½ or older, giving directly from your IRA (a qualified charitable distribution) can satisfy your RMD without adding to your taxable income.
- Tax-loss harvesting. This year's bond selloff left losses in some holdings. Selling those positions and reinvesting in something similar can "harvest" a loss to offset gains elsewhere, while keeping your portfolio on plan. In some cases, excess capital losses can be used to reduce a portion of your ordinary taxable income (otherwise taxed at a higher marginal rate).
- Roth conversions. Converting part of a traditional IRA to a Roth means paying tax now so future growth can be tax-free. Modeling helps us find the amount that fits within your current tax bracket and avoids unintended costs, like higher Medicare premiums.
- Charitable giving. Donating appreciated stock instead of cash avoids the capital gains tax on the gain. A donor-advised fund lets you make several years of gifts in one year, front-loading the tax deduction now while still disbursing grants to charities over time.
Each of these depends on details specific to you, such as other income, recent gains, and what your tax return looked like last year. Please reach out no later than early December, so we have time to run the numbers with you and with your accountant. Once the year ends, most of these opportunities are gone for 2026.
Keeping Perspective
A choppy quarter can feel unsatisfying, but it is a small piece of a long record. Even after a hard year for bonds, U.S. Large-Cap stocks are up about 13% so far in 2026, Developed International stocks about 10% and Emerging Markets about 23%.
Bumpy stretches are the norm, not the exception. Since 1980, the S&P 500's worst decline within a typical year has averaged about 14%. Even so, the index ended the year with a gain in 35 of those 46 years.
Quarters like this one can test patience, but they don't change the fundamentals of a well-built plan. Your portfolio is designed around your goals and time horizon, not the next headline. If anything in your life or finances has changed, or you'd simply like to talk through these markets, please reach out — we're always glad to hear from you.
One of Bristlecone Value Partners’ principles is to communicate frequently, openly, and honestly. We believe that our clients benefit from understanding our investment philosophy and the process behind it. Our views and opinions regarding investment prospects are "forward-looking statements" and may not be accurate over the long term. While we believe we have a reasonable basis for our appraisals and confidence in our opinions, actual results may differ materially from our expectations. Information provided in this blog should not be considered as a recommendation to purchase or sell any particular security. You can identify forward-looking statements by words like "believe," "expect," "anticipate," or similar expressions when discussing particular portfolio holdings. We cannot assure future results and achievements. You should not place undue reliance on forward-looking statements, which speak only as of the date of the blog entry. We disclaim any obligation to update or alter any forward-looking statements, whether as a result of new information, future events, or otherwise. Our comments are intended to reflect trading activity in a mature, unrestricted portfolio and might not be representative of actual activity in all portfolios. Portfolio holdings are subject to change without notice. Current and future performance may be lower or higher than the performance quoted in this blog. References to indexes and benchmarks are hypothetical illustrations of aggregate returns and do not reflect the performance of any actual investment. Investors cannot invest directly in an index, and returns do not account for the deduction of advisory fees or other trading expenses. There can be no assurance that current investments will be profitable. Actual realized returns will depend on, among other factors, the value of assets and market conditions at the time of disposition, any related transaction costs, and the timing of the purchase. Economic factors, market conditions, and investment strategies will affect the performance of any portfolio, and there can be no assurance that a portfolio will match or outperform any particular index or benchmark. Past Performance is not indicative of future results. All investment strategies carry the potential for profit or loss. Changes in investment strategies, contributions, or withdrawals can materially alter a portfolio's performance and results. Different types of investments involve varying degrees of risk, and there can be no assurance that any specific investment will be suitable or profitable for a client's investment portfolio. This content is developed from sources believed to provide accurate information, and it may not be used to avoid any federal tax penalties. Please consult legal or tax professionals for specific information regarding your individual situation. The opinions expressed and material provided are for general information and should not be considered a solicitation for the purchase or sale of any security.